Research Article - Journal of Molecular Pathophysiology (2023)
Potential microRNA Biomarker Panel for Predicting Evolution of Pancreatitis to Pancreatic Ductal Adenocarcinoma
Mira Nuthakki*, Vivian Utti and Serena McCallaMira Nuthakki, Department of Pathology, iResearch Institute, Indiana, USA, Email: mira.nuthakki3@gmail.com
Received: 25-Aug-2023, Manuscript No. JMOLPAT-23-111232; Editor assigned: 28-Aug-2023, Pre QC No. JMOLPAT-23-111232 (PQ); Reviewed: 12-Oct-2023, QC No. JMOLPAT-23-111232; Revised: 19-Oct-2023, Manuscript No. JMOLPAT-23-111232 (R); Published: 26-Oct-2023
Abstract
Purpose: Pancreatitis is one of the most important risk factors for Pancreatic Ductal Adeno Carcinoma (PDAC). PDAC is a silent, aggressive malignancy that has less than 5% survival rate at 5 years. Detection at early stage and resection of PDAC significantly improves survival. A differentially expressed microRNA panel was sought that could predict the risk of progression to PDAC from pancreatitis.
Methods: Differentially Expressed microRNA (DEM) in serum that was common between pancreatitis and PDAC were extracted from two microarray Genomic Spatial Event (GSE) datasets containing pancreatitis, PDAC, and control samples. Eight groups of DEM were derived from multiple bioinformatics methods such as differential expression, miRNA interaction networks, target gene prediction tools, functional enrichment analysis, and machine learning models. The functional enrichment pathway of these groups was identified.
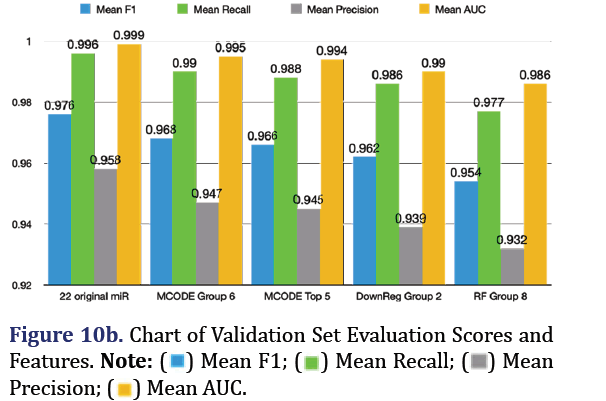
Results: These groups were trained on the original datasets and were used to predict pancreatic cancer in a validation set consisting of six other GSE datasets containing pancreatic cancer and controls. The miRNA panel with the highest precision and recall was the group derived from the target hub genes with the highest interaction (hsa-miR-28-3p, 320b, 320c, 320d, 532-5p, and 423-5p, with a mean F1 of 0.968, mean recall of 0.99, mean precision of 0.947, and mean AUC of 0.995).
Conclusion: These results provide a potential biomarker to identify and follow individuals at high risk for pancreatic cancer after pancreatitis.
Keywords
Pancreatic cancer; PDAC; microRNA; Biomarkers; Genomic spatial event
Introduction
Pancreatic cancer and pancreatitis
Pancreatic cancer is the 3rd most common cause of cancer related deaths and is projected to become the 2nd leading cause of cancer death by 2030 even as it comprises only 3.2% of all cancer cases [1]. Pancreatic Ductal Adenocarcinoma (PDAC) comprises 90%-95% of all pancreatic cancer [2]. Five-year survival for pancreatic ductal adenocarcinoma remains below 5%, with 80% of patients surgically unresectable at the time of presentation. The survival for surgically resectable pancreatic cancer is 17.4% at five years [3,4]. The most important predictor of survival in pancreatic cancer is resection of early stage cancer [5]. Currently, screening for early detection of pancreatic cancer via annual MRI or Endoscopic Ultra Sound (EUS) is recommended only in the approxi-mately 10% of individuals with hereditary or genetic syndromes [6,7]. Risk factors include smoking, aging, diabetes, obesity, alcohol, pancreatitis, and genetic factors [7].
Per 100,000 people in the general population, the yearly global incidence of acute pancreatitis is 34 cases, and chronic pancreatitis is 10 cases. The global transition rate from the first episode of acute pancreatitis to a recurrent episode is ~20% and, from recurrent acute pancreatitis to chronic pancreatitis, the rate is ~35% [8]. Pancreatic cancer risk increases 20 times during the first two years after acute pancreatitis (inflammation of the pancreas), and remains double that of the general population after five years [9]. There is an increasing prevalence of pancreatitis and associated years lived with disability [10]. Acute pancreatitis may be the first manifestation of chronic pancreatitis, especially in the setting of persistent triggers such as alcohol. Chronic pancreatitis has a 15-16-fold higher risk of developing pancreatic cancer over the general population [2].
Pancreatic cancer blood biomarkers
Kirsten Rat Sarcoma Virus (KRAS), p16, TP53 (Tumor protein p53), SMAD4 (Mothers against decapentaplegic homolog 4) gene abnormalities are typically found in most PDAC, although they are non-specific and are involved in multiple other cancers [4]. An optimal biomarker would need to be sensitive, reasonably specific and easily accessible, such as through blood. Currently, CA19-9 is the only clinically used blood bio-marker. Due to limited sensitivity and specificity, it is only used to detect recurrence of pancreatic adenocarcinoma. Some blood biomarkers have been stud-ied for early diagnosis of pancreatic cancer, some of which include CA19-9, peptide panels, tumor-associated autoantibodies and microRNAs [7].
microRNA are single stranded non-coding RNA that are involved in RNA silencing and regulation of gene expression. microRNA was chosen as a potential biomarker for this study due to the ease of detection of relatively small numbers of molecules, and stability compared to mRNA [11]. High-throughput analysis such as DNA microarray and next-generation sequencing allow access to all of the microRNA in the sample. microRNA was the predominant type of blood biomarker available for pancreatitis and PDAC in available public datasets. A few different microRNA panels have also been validated as blood biomarkers for pancreatic cancer in previous studies [7]. Many of the prior biomarker studies aimed to differentiate pancreatic cancer precursors Pancreatic Intraepithelial Neoplasia (PanIN), intraductal papillary mucinous neoplasm, or mucinous cystic tumors and pancreatitis, from pancreatic cancer [7] found specific panels that differentiated chronic pancreatitis from pancreatic cancer. However, there have been no studies on common biomarkers in pancreatitis and PDAC that may predict evolution from the former to the latter.
This study aims to identify, compare, and extract Differentially Expressed microRNA (DEM) panel in serum that could predict risk of progression to PDAC from pancreatitis. If a high risk of PDAC could be predicted early in patients who have had pancreatitis, by identifying specific microRNA that tend to be common to pancreatitis and PDAC, they can then undergo annual MRI imaging screening to detect early stage cancer, given that resection of early stage cancer carries the best prognosis. Downstream and upstream target pathways could also be targets for the developments of therapeutics. DEM panels were obtained from up-regulated and down-regulated miRNA, Area Under the ROC (AUC) curves and Pearson correlation analysis, miRNET interaction analysis, Cytoscape MCODE clusters, and machine learning models such as decision tree and random forest. The DEM panel with the highest precision and recall was obtained from testing on a separate, larger validation set.
Materials and Methods
microRNA expression datasets and DEM extraction
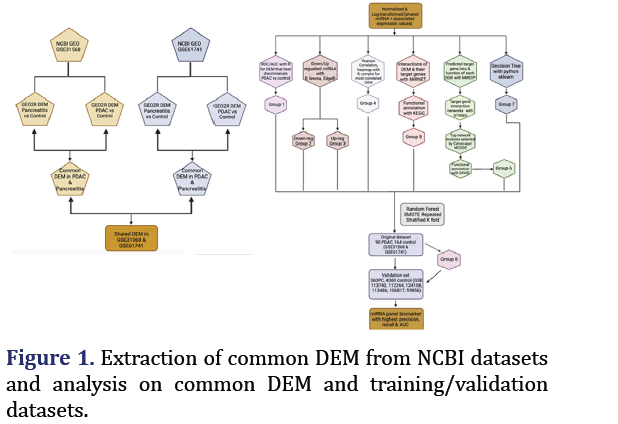
NCBI GEO microarray datasets GSE31568 and GSE61741 containing pancreatitis, control, and PDAC samples for peripheral blood microRNA were chosen using keywords ‘pancreatic’, ’serum’, ‘homo sapiens’ and using the non-coding RNA profiling by array filter. The Differentially Expressed miRNA (DEM) of pancreatitis vs. control and the PDAC vs. control of each GEO dataset were obtained from GEO2R. The common differentially expressed microRNA (n=23) of the two GSE datasets were extracted through a Venn diagram [12].
Expression values for these 23 miRNA in each dataset were combined through Geoquery R package. There were 90 PDAC, 75 pancreatitis, and 164 control samples.
ROC curves and AUC analysis
Expression values of the total DEM were normalized and log-transformed through limma R package. ROC curves and AUC were used to determine the ability of each DEM to differentiate pancreatitis vs. control and PDAC vs. control. The top miRNA with AUC>0.8 formed group 1.
Up and down-regulated DEM
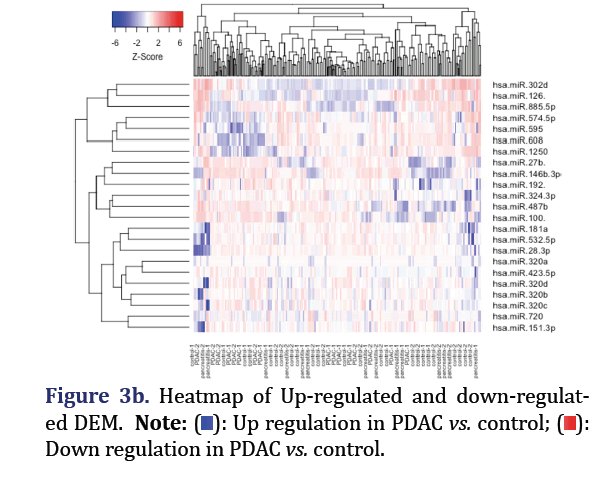
The significantly down-regulated and up-regulated DEM in the total dataset for PDAC vs. control were analyzed through edge R in R to form group 2 and 3 respectively. Edge R uses Trimmed Mean of M-Values (TMM) normalization, negative binomial distribution for the read counts distribution, and exact test for the differential expression. These were plotted with the statmod library. The expression values of the up/ down-regulated DEM were then used to execute hierarchical clustering with the method parameter set to ‘complete’. The result was then visualized as a heat map through the gplot package.
Correlation analysis
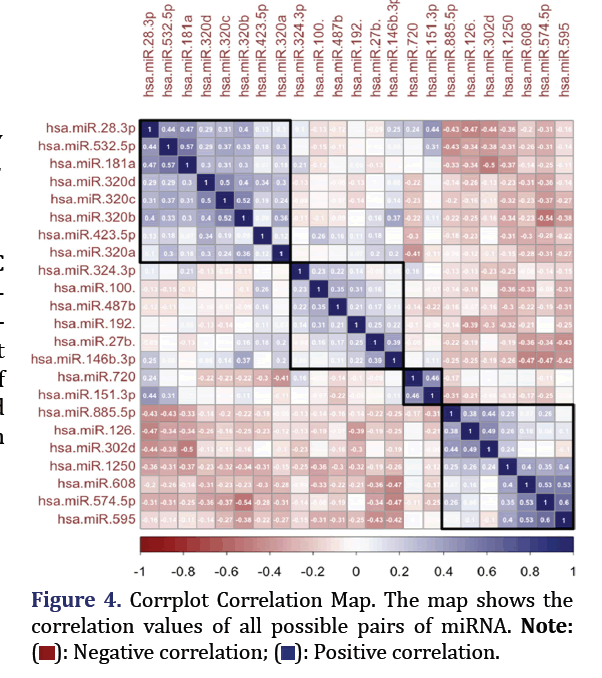
Using R, corrplot, and the RColorBrewer package, Pearson correlation coefficients were obtained and visualized as a Corrplot correlation map. The top 4 most correlated miRNA formed group 4.
MiRNET miR interaction network
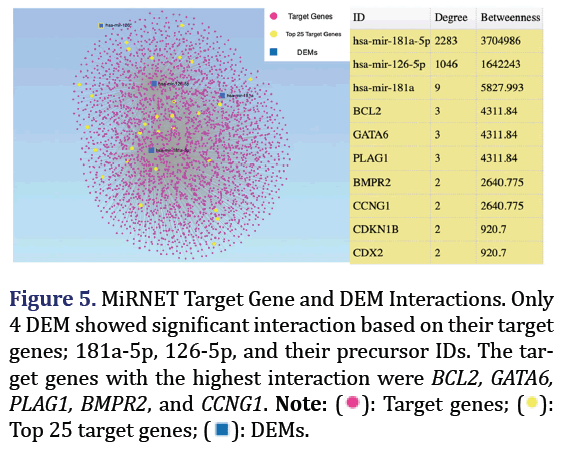
MiRNET links miRNA to their targets and other cor- related molecules. Correlated DEMs and their target genes, as well as their functional annotations were obtained using the hyper geometric algorithm and Kyoto Encyclopedia of Genes and Genomes (KEGG) pathway and in the MiRNET miRNA interaction tool, with a 2-degree cut-off. The closest miRNA formed group 5.
MiRDIP target prediction
MiRDIP is a microRNA data integration portal which supplies numerous miRNA target predictions. Predicted target gene lists of each DEM were acquired based on an integrative score of confidence.
STRING interaction network, cytoscape MCODE, and functional enrichment analysis
Target gene interaction networks were predicted with the STRING database, with the confidence interaction score set to greater than 0.7 [13]. The protein-protein interaction networks were uploaded to Cytoscape [14]. The top network modules were selected by Molecular Complex Detection (MCODE) plug-in in Cytoscape. The degree cut off was set to 2, the node score cut off as 0.2, k-core as 2, and maximum depth as 100. The average degree of the MCODE score and nodes were chosen as the cut off score, with >4 and >12 used for MCODE scores and hub nodes respectively. Functional enrichment analysis was then performed using DAVID functional annotation tool for all target genes and top modules. Reverse MiRDIP was used to find the miRNA associated with the top module target genes. Any shared miRNA between these and the original 23 DEM formed group 6.
Machine learning analysis
The expression values of the 23 DEM were processed using min-max normalization, in the pandas and numpy python 3.7 packages. MiRNA 720 from the 23 common miR was removed as Schopman et al. showed that the sequence annotated as miR-720 is likely to be a fragment of a tRNA [15]. Using the sklearn package in Python, a decision tree model (max depth=10) was trained and tested on PDAC and control samples.
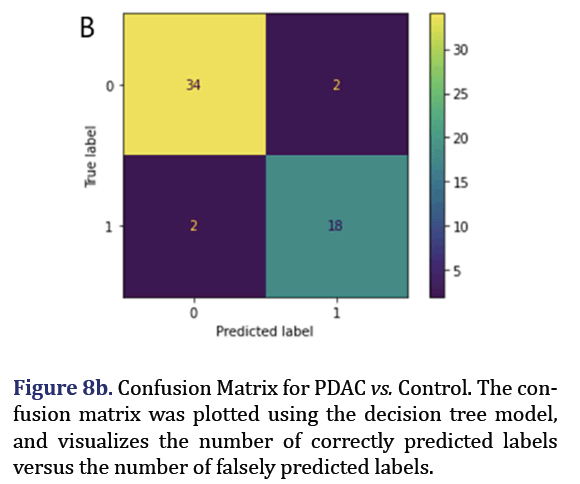
ROC curves were plotted and AUC scores were determined based on this model. A confusion matrix was visualized using pyplot from matplotlib. The top 5 most important features of the decision tree were extracted to form group 7. All the groups were analyzed through mirpath for functional pathway involvement. Random Forest SMOTE model with Repeated Stratisfied KFold (n_splits=10, n_repeats=3) was utilized to train the imbalanced data. This model oversamples the minority label of an imbalanced dataset. Evaluation metrics, including mean F1 scores, mean preci- sion, mean recall and AUC were procured. The various features, or DEM, were ranked by importance based on this SMOTE model.
Validation
Six datasets containing pancreatic cancer and control samples (4360 controls and 360 pancreatic cancers) were combined and processed with GEO2R, and Geoquery, limma packages in R studio. The fitted SMOTE random forest model from the training data was used to predict pancreatic cancer in this validation set with similar evaluation metrics as for the training dataset. Of note, miRNA 885-3p and 320d-1 which were part of the original 22 DEMs were only available as the precursor 885-5p and 320d in the validation dataset. 5p indicates the microRNA from the 5 prime arms of the hairpin and 3p indicates 3 prime ends as shown in Figure 1.
Results
ROC curves and AUC analysis
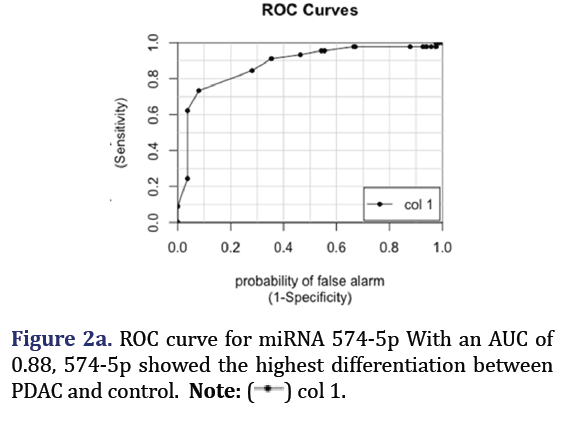
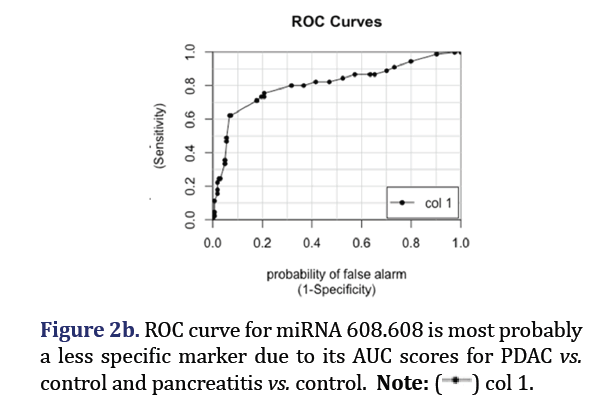
The ROC curves demonstrated that hsa-miR-574-5p showed the highest differentiation between PDAC and control with an AUC 0.88 as shown in Figure 2a. Hsa-miR-608 had the second highest AUC of 0.81 for PDAC vs. control but had the highest AUC (0.88) for differentiating pancreatitis vs. control as shown in Figure 2b. These two miRNA formed group 1.
Up/down regulated DEM
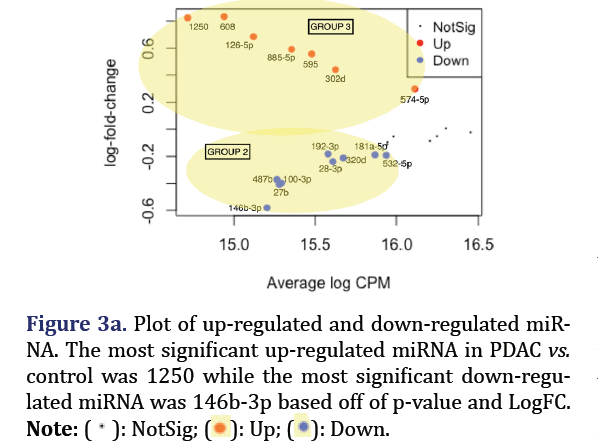
The most significant down-regulated miRNA in PDAC vs. control consist of hsa-miR-146b-3p, 27b, 100- 3p, 487b, 28-3p, 320d, 192-3p, 181a-5p, and 532-5p formed group 2 (p<0.05). The most significant up-regulated miRNA in PDAC vs. control consisted of hsa-miR-1250, 608, 126-5p, 885-5p, 595, 302d, and 574-5p, and formed group 3 (p<0.05) as shown in Figures 3a and 3b.
Correlation analysis
Pearson correlation coefficients showed the top two pairs of correlated miRNA to be hsa-miR-574-5p and hsa-miR-595; hsa-miR-532-5p, and hsa-miR-181a-5p (p<0.0005, correlation 0.6 and 0.56 respectively) as shown in Figure 4. These formed group 4.
MiRNET interaction network
MiRNET showed 4 DEM with the closest interactions based on target genes and downstream pathways: 181a and 126 and their most abundant mature forms, 181a-5p and 126-5p which formed group 5 as shown in Figure 5. The highest interactions were found between these DEM and their target genes. The most significantly enriched pathway of these DEMs was the neurotrophin signalling pathway.
Cytoscape MCODE clusters
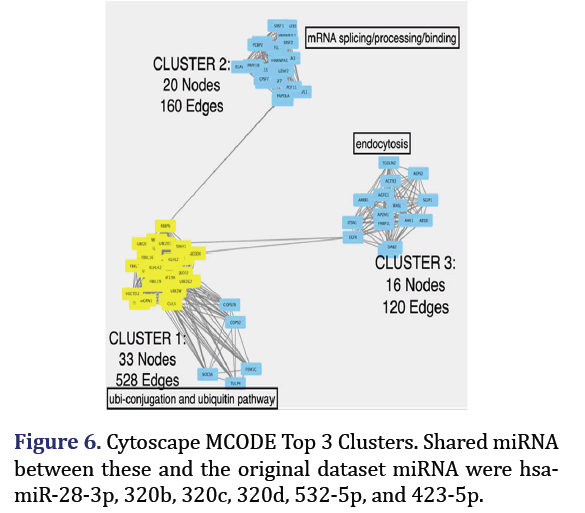
1542 target genes were achieved for the 23 DEM with a top 1% cutoff from the MiRDIP. Target gene pro- tein-protein interaction network of these target genes from STRING was uploaded to Cytoscape MCODE plug-in which identified 3 clusters with the strongest interactions of all target genes as shown in Figure 6. Cluster 1 (33 nodes, 528 edges) main pathway was ubi-conjugation and ubiquitin pathway; cluster 2 (20 nodes, 160 edges) was mRNA.
Splicing/processing/binding: Cluster 3 (16 nodes, 120 edges) was mainly endocytosis. The shared miR- NA associated with these clusters hub genes and the original 23 miRNA formed group 6 (hsa-miR-28-3p, hsa-miR-320b, hsa-miR-320c, hsa-miR-532-5p, hsa- miR-320d, hsa-miR-423-5p).
Decision tree model
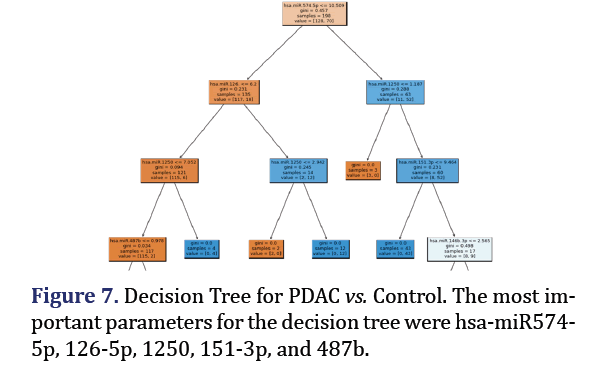
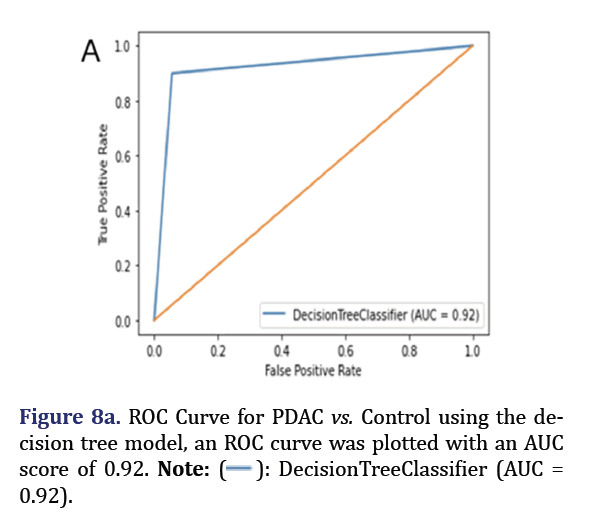
A decision tree was trained and tested for PDAC and control was analyzed to obtain 5 most important pa- rameters to form group 7 with AUC 0.92 as shown in Figure 7. A confusion Matrix and ROC curve was plot- ted using the same decision tree model as shown in Figures 8a and 8b.
For the group 7 of miRNA, the top 5 most important parameters in the decision tree were found as hsa-miR-574-5p, hsa-miR-126-5p, hsa-miR-1250-5p, hsa-miR-151-3p, hsa-miR-487b-3p.
Random forest training dataset
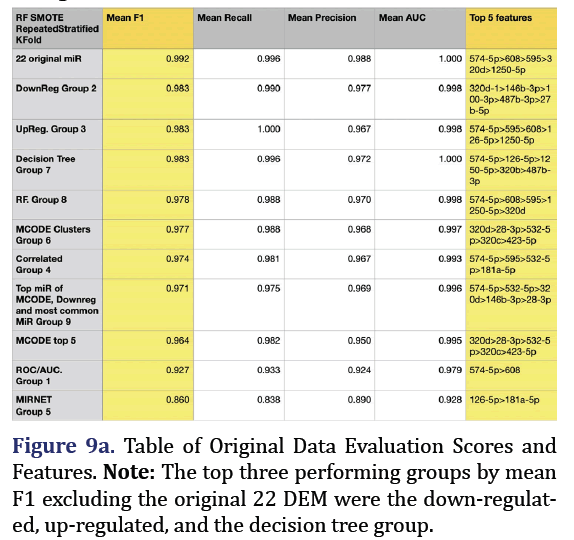
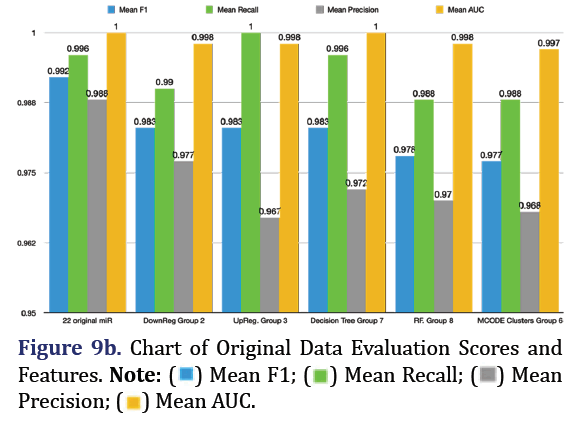
Random Forest SMOTE model was used to extract top 5 important features of the original 22 DEM to form group 8. F1 is the harmonic mean of the model’s precision and recall and is the most reliable predic- tor for imbalanced data. The most predictive group was the original 22 microRNA group (mean F1 0.992, mean recall 0.996, mean precision 0.988, mean AUC 1.000). The second most predictive group was the down-regulated group 2 (mean F1 0.983, mean recall 0.99, mean precision 0.977, mean AUC 0.998, with the top 5 most important features being 320d, 146b-3p, 100-3p, 487b-3p, and 27b-5p). The third most pre- dictive group was the up-regulated group 3 (mean F1 0.983, mean recall 1.0, mean precision 0.967, mean AUC 0.998, with the top most important features being 574-5p, 595, 608, 126-5p, and 1250-5p) as shown in Figures 9a and 9b.
Random forest SMOTE showed F1 scores increased with the number of miRNA taken in the group and was highest for the original unfiltered group of 22 miRNA.
Validation set
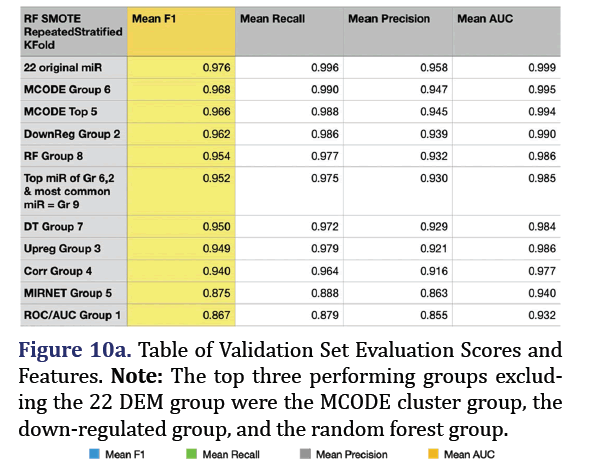
The fitted random forest SMOTE model from the training dataset was applied to predict pancreatic cancer in the combined validation dataset. The most predictive group remained the 22 original microRNA group (mean F1 0.976, mean recall 0.996, mean precision 0.958, mean AUC 0.999). The top 3 subsequent groups for the validation set included the MCODE group 6 (mean F1 0.968, mean recall 0.99, mean precision 0.947, mean AUC 0.995), the down-regulated group 2 (mean F1 0.962, mean recall 0.986, mean precision 0.939, mean AUC 0.99), and the random forest group 8 (mean F1 0.954, mean recall 0.977, mean pre- cision 0.932, mean AUC 0.986) as shown in Figures 10a and 10b.
Discussion
Group 1
Group 1 included hsa-miR-574-5p and 608. Hsa-miR- 574-5p is known to be involved in fatty acid elongation, base excision repair, hippo signalling pathway, lysine degradation, purine metabolism, and viral carcinogenesis [16]. It is known to be involved in lung adenocarcinoma, small cell lung cancer, breast cancer, gastric cancer, and nasopharyngeal cancer [17-22]. It is also involved in other inflammatory pathways including diabetes, asthma, and cardiac remodelling [23-26]. It has not been found as a differentiating signature in pancreatic cancer previously.
Mir-608 was shown to promote apoptosis via BRD4 downregulation in PDAC [27]. It is also involved in metabolism of xenobiotic by cytochrome P450, transcriptional misregulation in cancer, and base excision repair [16]. It has a role in regulation of apoptosis in non-small cell lung cancer, as well as other multiple types of cancer [28,29].
Group 2
Group 2 included miR-146b-3p, 27b, 100-3p, 487b, 28-3p, 320d, 192-3p, 181a-5p, 532-5p. The most significant pathways for the downregulated group were steroid biosynthesis, hippo signalling pathway, ECM-receptor interaction, adherens junction, proteoglycans in cancer, lysine degradation, and viral carcinogenesis (p<0.005). These are also known to be involved in prostate cancer, colorectal cancer, endometrial cancer, and non-small cell lung cancer [16].
MiRNA 146b-3p is also involved in hepatocellular carcinoma, pancreatic cancer, and thyroid cancer [30-32]. 146b-3p induces apoptosis and blocks proliferation in pancreatic cancer stem cells by targeting the MAP3K10 gene.
MiRNA 100-3p is also known to be involved in esophageal and gastric cancers, vulvar carcinoma, and bladder cancer [33-35]. MiRNA 27b-5p is involved in oral cancer, ovarian carcinoma, and gastric cancer [36-38]. MiRNA 487b-3p is involved in colon cancer, osteosarcoma, and anaphylactic reactions [39,40]. MiRNA 28-3p is involved in Alzheimer’s, nasopharyngeal cancer, gastric cancer, thyroid cancer, and esophageal squamous cell carcinoma [41-43]. MiRNA 532- 5p is involved in breast cancer, glioma, gastric cancer, ovarian cancer, renal carcinoma, and ischemic stroke [28,44-48]. MiRNA 320d is involved in hepatocellular carcinoma, aortic dissection, and diffuse large B-cell lymphoma [27,49,50]. 320d is most associated with colorectal cancer [51]. MiRNA 181a-5p is involved in atherosclerosis, bladder cancer, glioblastoma, pros- tate cancer, endometrial cancer, and breast cancer [52-57]. MiRNA 192-3p is involved in renal disease and gastric cancer [58,24].
Group 3
Group 3 included miR-1250, 608, 126-5p, 885-5p, 595, 302d and 574-5p. The most significant (p<0.005) pathways for the upregulated DEM were proteoglycans in cancer, hippo signalling pathway, lysine degradation, viral carcinogenesis, base excision repair, metabolism of xenobiotic by cytochrome P450, and transcriptional misregulation in cancer.
They were also known to be involved in non-small cell lung cancer, colorectal cancer, chronic myeloid leukemia, and pancreatic cancer [15].
MiRNA 126-5p is involved in ovarian cancer, acute myocardial infarction/atherosclerosis, endometriosis, and cervical cancer [59-63]. 126-5p was noted to differentiate severe acute pancreatitis from mild acute pancreatitis [21]. MiRNA 302d-3p is involved in endometrial cancer, cervical squamous cell carcinoma, glaucoma, osteoarthritis, gastric cancer, and breast cancer [64-69]. MiRNA 885-3p is involved in clear cell renal carcinoma and gastric cancer [70,71].
MiRNA 1250-5p is a tumor suppressive miRNA, which is silenced by DNA methylation of Apoptosis Associated Tyrosine Kinase (AATK) gene in non-Hodgkin’s lymphoma [72]. MiRNA 595 is involved in hepatocellular carcinoma, ovarian cancer, glioblastoma, and inflammatory bowel disease [73-75].
Group 4
Group 4 included pairs hsa-miR-574-5p and 595; 532-5p and 181a-5p. Group 4 had the most significant (p<0.001) pathways as hippo signalling pathway, lysine degradation, proteoglycans in cancer, viral carcinogenesis, and TGF-beta signalling pathway.
These miRNA were also involved in glioma, endometrial cancer, colorectal cancer, non-small cell lung cancer, prostate cancer, thyroid cancer, and pancreatic cancer [16].
Group 5
Group 5 included hsa-miR-181a, 126, 181a-5p and 126-5p. The most significant (p<0.0001) shared pathways of this group were neurotrophin signalling pathway, proteoglycans in cancer, viral carcinogenesis, and signalling pathways regulating pluripotency of stem cells. They were also involved in glioma, endometrial cancer, non-small cell lung cancer, colorectal cancer, prostate cancer, pancreatic cancer, renal cell carcinoma, and chronic myeloid leukemia [16].
Group 6
Group 6 included hsa-miR-28-3p, 320b, 320c, 532-5p, 320d and 423-5p. For these group 6 miRNA, the most significant (p<0.006) pathways were fatty acid bio-synthesis, adherens junction, hippo signalling pathway, proteoglycans in cancer, lysine degradation, viral carcinogenesis, and fatty acid metabolism. They were also associated with glioma, Huntington’s disease, pancreatic cancer, and non-small cell lung cancer [16]. MiRNA 320b is involved in Chronic Obstructive Pulmonary Cancer (COPD), osteosarcoma, glioma, and atherosclerosis [76-79]. 320b suppresses pancreatic cancer cell proliferation by targeting the FOXM1 gene [80]. MiRNA 320c is involved in pulmonary disease/asthma, cervical cancer, breast cancer, bladder cancer, colorectal cancer, myelodysplastic, and osteoarthritis [27,81-86]. 320c regulates the resistance to gemcitabine through SMARCC1 [87]. MiRNA 423-5p is involved in osteosarcoma, prostate cancer, glioblastoma, ovarian cancer, thyroid cancer, colorectal cancer, pulmonary tuberculosis, and many other cancers [88-94].
Group 7
Group 7 included hsa-miR-574-5p, 126-5p, 1250-5p, 151-3p and 487b-3p. For the group 7 of miRNA found as the top 5 most important parameters in the decision tree, the most significant (p<0.009) pathways were proteoglycans in cancer, viral carcinogenesis,biosynthesis of unsaturated fatty acids, and hippo signalling pathway. These miRNA have also been as- sociated with non-small cell lung cancer, colorectal cancer, glioma, endometrial cancer, renal cell carcino- ma, chronic myeloid leukemia, and pancreatic cancer [16].
MiRNA 151-3p is also involved in breast cancer, osteosarcoma, myocardial infarction, cholangiocarcinoma, nasopharyngeal carcinoma, and gastric cancer [95-99].
Group 8
Group 8 included hsa-miR-574-5p, 608, 1250-5p, 595 and 320d. For group 8, the most significant (p<0.05) pathways were hippo signalling pathway, base excision repair, transcriptional misregulation in cancer, metabolism of xenobiotics by cytochrome P450, TGF-beta signalling pathway and adherens junction.
A validation dataset that had only pancreatic cancer and control but not pancreatitis, was chosen for two reasons:
- There was no other publicly available data containing pancreatic cancer, pancreatitis, and control that hadn’t already been used for training (which was already a small dataset).
- To evaluate the consistency of the best performing mRNA group from the training data when applied to a dataset to differentiate pancreatic cancer and control without the benefit of pancreatitis data.
There would be no data to confirm if predicted pancreatic cancer evolved from an earlier episode of pancreatitis in this validation dataset. However, the f1 scores could point to validity of the chosen miR-NA group in predicting pancreatic cancer in patients with either no history of pancreatitis or with history of un-recalled or sub-clinical pancreatitis in the past, purely based on a very strong correlation of this miR- NA group with PDAC (90% of pancreatic cancer).
Animal model studies have revealed that pancreatic cancer cells metastasize to the liver before the primary site of origin is even detected. This rapid tumor progression is thought to be secondary to Epithelial to Mesenchymal Transition (EMT). The most common signalling pathways affected in pancreatic cancer are the Transforming Growth Factor-beta (TGF-β) signalling pathway in EMT, wnt/beta-catenin signalling pathway, notch signalling pathway, snail transcription factors, zeb transcription factors, and basic Helix Loop Helix transcription factors (bHLH) [100-112].
All of the miRNA panels showed good performance with AUC>0.92 and F1 scores >0.85. Almost all of the microRNA panel groups included in the study involved nearly all of the known established pathways in pancreatic cancer. These included Hippo signalling, proteoglycans in cancer, neurotrophin signalling pathways, lysine degradation, TGF-beta signalling, viral carcinogenesis, fatty acid biosynthesis and metabolism, adherens junction, and ECM-receptor interaction Kyoto Encyclopedia of Genes and Genomes (KEGG fig pathway) [113].
The hippo signalling pathway in pancreatic cancer is executed by two major proteins, YES Associated Protein (YAP) and Transcriptional Coactivator with PDZ-Binding Motif (TAZ). These promote a strong stromal reaction in the pancreatic Tumor Micro Environment (TME), even in the absence of KRAS [102]. Proteoglycans are involved in the P13K-Akt signalling pathway, MAPK, Wnt signalling pathways, focal adhesion, VEGF and TGF-beta signalling pathways [103]. Perineural invasion, although present in several tumors, has the highest prevalence in PDAC, ranging from 70%-90%, including in early-stage and microscopic PDAC, suggesting that it could represent an early event in tumor progression. Neurotrophin are growth factors which increase growth, proliferation, and nerve-cancer affinity in perineural invasion [104]. Neurotrophin affect downstream pathways such as MAPK signalling pathway, ubiquitin mediated proteolysis, and apoptosis [105].
Ubiquitination and acetylation are common lysine modifications. Ubiquitination was a common pathway in cluster 1 target hub genes in this study. Downstream associated pathways include cell-cell adhesion, nucleoplasm, and RNA binding. Lysine modification related mutations are associated with worse survival [106].
Helicobacter pylori and hepatitis viruses have been linked to pancreatic cancer, possibly through inflammatory signalling pathways including proinflammatory cytokines, Toll Like Receptor (TLR)/Myeloid Differentiation Primary Response 88 (MyD88) pathway, Nuclear Factor-Kappa B (NF-κB), up-regulating transcription factors involved in EMT regulation [45]. Pathways involved in hepatitis viral carcinogenesis include MAPK, P13K-Akt, Jak-STAT, p53, NF-kappaB, and apoptosis [107].
Group 6 had a prominent role in fatty acid synthesis and metabolism. Many enzymes involved in cholesterol synthesis are up-regulated in pancreatic cancer [108]. Fatty acid metabolism is regulated by oncogenic signal transduction pathways, such as P13K- Akt-mTOR signalling. Fatty acids also participate in remodelling the tumor microenvironment [109].
Adhesion pathways and ECM interactions may play a role in the evolution of pancreatitis to pancreatic ductal cancer. Loosening of cell-cell adhesion between pancreatic cells disrupts structure and promotes permeability, inflammatory cell migration, and interstitial edema.
Oxidative stress in pancreatitis leads to up-regulation of adhesion molecules, such as P-selectin and ICAM-1. These are thought to play a role in the pathological features of acute and chronic pancreatitis, which include inflammatory cell infiltration, stroma formation, and fibrosis. At adherens junctions, tyrosine phosphorylation, of the cadherin-catenin complex, regulates cell contacts. Upregulation of E-cadherin, an adhesion protein, is associated with promotion of the repair of cell-cell-adhesions and protective re- sponse [110]. However, E-Cadherin down-regulation is a critical component of EMT, such that it has even been considered as a marker for EMT [111]. Adherens junction is also involved in Wnt, MAPK, and TGF-beta signalling pathways [112].
Stromal cell-derived ECM (Extracellular Matrix) proteins were found to be non-specific, but tumor-cell derived ECM proteins were correlated with poor prognosis. Incidence of Pancreatic Intraepithelial Neoplasia (PanIN) increases to 60% in pancreatitis. Collagens were the most important group of proteins in PDAC progression and pancreatitis. Stromal matrix changes in pancreatitis are a subset of the changes in PDAC, however, PDAC, compared with PanIN and pancreatitis, up-regulates the largest portion of matrisome proteins, thus representing the most fibrotic state. Wingless-Related Integration Site (Wnt) pro- teins may be active in progression of PanIN to PDAC, but not relevant in pancreatitis. Proteoglycans and focal adhesion are involved in ECM receptor interaction [113].
It is significant to note that the best performance in both the training and validation sets was garnered by the panel that had the highest no. of included miR, which was the original set of miR (n=22). The second best performance in the validation set was by group 6, which had one of the higher no. of miR (n=6). The third best performance in the validation set was by the down-regulated Group 2 (n=9), which was also the group with the second best performance in the training dataset. A larger group of miRNA may have greater predictive ability secondary to diversity of signalling pathways included. Similarly, although 574-5p came up often in many groups and was the most important feature in the decision tree model (group 7) and the random forest model (group 8), it was likely less specific than a combination of grouped miRNA which likely represent diverse pathways in multifactorial pancreatic cancer.
Previous studies found miRNA biomarker panels in plasma such as miR-18a [114], 16, 196a, CA19-9 [7],22, 642b, 885 [115]. Serum miRNA panels included 20a, 21, 24, 25, 99a, 185, 191, 1290 [116], 125a, 4294, 4476, 4530, 6075, 6799, 6836, 6880 [117], 373 [118], 133a [119], 663a, 642b, 5100, 8073 [120], 1290, 1246, CA19-19 [121], 16, 18a, 20a, 24, 25, 27a, 29c, 30a-5p, 191, 323-3p, 345 and 483-5p [122]. Blood miRNA panels included 26b, 34a, 122, 126*, 145, 150, 223, 505, 636, 885-5p [123]. Of the above, serum panels of 20a, 21, 24, 25, 99a, 185, 191, and plasma panel of 16, 196a, and CA19-9 also differentiated from chronic pancreatitis and PDAC. 181d differentiated from Auto-immune pancreatitis and PDAC [124].
The lack of any significant miRNA shared between the different studies and our study is likely due to different sample preparation protocols and detec- tion methodologies as well as the type of sample it- self (plasma vs. serum vs. whole blood) [120]. The functional pathways associated with the microRNA panels of the prior studies did have much in common with the pathways elucidated in this study. However, when compared to this study, the difference is at least partly intentional due to extraction of microR- NA that was common to both pancreatitis and PDAC in the current study, as opposed to previous studies that tried to differentiate the miRNA groups for pancreatitis and PDAC. Despite this, the original 22 group and the down-regulated group 2 demonstrate good prediction of PDAC in datasets that both include and exclude information regarding pancreatitis origin of pancreatic cancer.
There were some limitations in the study. Imbalanced datasets (35% PDAC in training dataset, 8% pancreatic cancer in validation set, with the rest being controls) were addressed with a model designed to oversample the minority label and cross validated. Smaller training dataset (n=254) may have affected results. The training dataset had pancreatic ductal adenocarcinoma, while the larger validation data- set combining 6 GSE datasets had pancreatic cancer. Since PDAC constitutes over 90% of pancreatic cancer, the discrepancy is limited but present. Many publicly available databases and studies including TCGA (The Cancer Genome Atlas) also include exclusively “pancreatic cancer” (with no specification if this constituted PDAC or non-PDAC). Given different molecular pathways and far worse prognosis of PDAC compared to other less common pancreatic cancers such as neuroendocrine tumors, the inclusion under a common umbrella of pancreatic cancer may skew data analytic results [125].
Conclusion
A new serum biomarker panel of 22 microRNA pre- dicting evolution of pancreatitis to pancreatic ductal adenocarcinoma, and its associated pathways, has been identified, that also performed very well in dis- tinguishing pancreatic cancer (with or without pancreatitis risk factor) from control. A smaller panel of 9 microRNA (hsa-miR-146b-3p, 27b, 100-3p, 487b, 28- 3p, 320d, 192-3p, 181a-5p, and 532-5p) had the sec- ond best performance. The goal of identifying com- mon microRNA between pancreatitis and PDAC in a patient who has had pancreatitis is to use those bio- markers as a screening test to identify those patients with pancreatitis, who would benefit from undergo- ing annual MRI imaging screening. Thereby, potential early stage PDAC can be discovered, and resected, thereby enabling the best chance of cure.
The inflammation to tumor progression and its impli- cation in the discovery of modern day biomarkers is a potential target for future studies. Larger case con- trol and cohort studies, with standardized sequencing protocols would be helpful. Sample collection (blood vs. serum vs. plasma) would benefit from standardiza- tion, with an eye towards accuracy and ease of pro- cessing. Specification of pancreatic ductal adenocarci- noma vs. pancreatic cancer would be needed to avoid skewing data with the more benign types of pancreat- ic cancer, such as neuroendocrine tumors. Applicabil- ity to other tumors should be expanded upon, given many common signalling pathways. Eventually, pro- spective experimental studies would be needed.
Serial acquisition of common biomarkers from the first episode of pancreatic pathology could predict evolution from pancreatitis and other precursors to PDAC. Given many common target pathways, these biomarkers may also incidentally detect other can- cers, such as lung and gastrointestinal cancers.
References
- Rahib L, Wehner MR, Matrisian LM, Nead KT. Estimated projection of US cancer incidence and death to 2040. JAMA Network Open 2021;4(4):e214708.
- Uomo G, Rabitti PG. Chronic pancreatitis: relation to acute pancreatitis and pancreatic cancer. Ann Ital Chir 2000;71(1):17-21.
- Bengtsson A, Andersson R, Ansari D. The actual 5-year survivors of pancreatic ductal adenocarcinoma based on real-world data. Sci Rep 2020;10(1):16425.
- Morani AC, Hanafy AK, Ramani NS, Katabathina VS, Yedururi S, Dasyam AK, et al. Hereditary and sporadic pancreatic ductal adenocarcinoma: Current update on genetics and imaging. Radiol Imaging Cancer 2020;2(2):e190020.
- Cancer Stat Facts: Pancreatic Cancer. SEER Cancer 2020.
- Aslanian HR, Lee JH, Canto MI. AGA clinical practice update on pancreas cancer screening in high-risk individuals: expert review. Gastroenterology 2020;159(1):358-362.
- Al-Shaheri FN, Alhamdani MS, Bauer AS, Giese N, Buchler MW, Hackert T, et al. Blood biomarkers for differential diagnosis and early detection of pancreatic cancer. Cancer Treat Rev 2021;96:102193.
- Petrov MS, Yadav D. Global epidemiology and holistic prevention of pancreatitis. Nat Rev Gastroenterol Hepatol 2019;16(3):175-184.
- Kirkegard J, Cronin-Fenton D, Heide-Jørgensen U, Mortensen FV. Acute pancreatitis and pancreatic cancer risk: a nationwide matched-cohort study in Denmark. Gastroenterology 2018;154(6):1729-1736.
- Ouyang G, Pan G, Liu Q, Wu Y, Liu Z, Lu W, et al. The global, regional, and national burden of pancreatitis in 195 countries and territories, 1990-2017: A systematic analysis for the Global Burden of Disease Study 2017. BMC Med 2020;18:1-3.
- Schwarzenbach H, Nishida N, Calin GA, Pantel K. Clinical relevance of circulating cell-free microRNAs in cancer. Nat Rev Clin Oncol 2014;11(3):145-156.
- Sterck L. Calculate and draw custom Venn diagrams. Bioinformatics 2016.
- Szklarczyk D, Gable AL, Lyon D, Junge A, Wyder S, Huerta-Cepas J, et al. STRING v11: protein–protein association networks with increased coverage, supporting functional discovery in genome-wide experimental datasets. Nucleic Acids Res 2019; 47(D1):D607-D613.
- Smoot ME, Ono K, Ruscheinski J, Wang PL, Ideker T. Cytoscape 2.8: new features for data integration and network visualization. Bioinformatics 2011;27(3):431-432.
- Schopman NC, Heynen S, Haasnoot J, Berkhout B. A miRNA-tRNA mix-up: tRNA origin of proposed miRNA. RNA biol 2010;7(5):573-576.
- Vlachos IS, Zagganas K, Paraskevopoulou MD, Georgakilas G, Karagkouni D, Vergoulis T, et al. DIANA-miRPath v3. 0: deciphering microRNA function with experimental support. Nucleic Acids Res 2015;43(W1):W460- W466.
- Jiang W, He Y, Ma Z, Zhang Y, Zhang C, Zheng N, et al. hsa_circ_0008234 inhibits the progression of lung adenocarcinoma by sponging miR-574-5p. Cell Death Discov 2021;7(1):123.
- Sun Y, Yi Y, Gan S, Ye R, Huang C, Li M, et al. miR-574-5p mediates epithelial-mesenchymal transition in small cell lung cancer by targeting vimentin via a competitive endogenous RNA network. Oncol Lett 2021;21(6):1-9.
- Zhang KJ, Hu Y, Luo N, Li X, Chen FY, Yuan JQ, et al. miR-574-5p attenuates proliferation, migration and EMT in triple-negative breast cancer cells by targeting BCL11A and SOX2 to inhibit the SKIL/TAZ/CTGF axis. Int J Oncol 2020;56(5):1240-51.
- Akimniyazova A, Pyrkova A, Uversky V, Ivashchenko A. Predicting associations of miRNAs and candidate gastric cancer genes for nanomedicine. Nanomaterials 2021;11(3):691.
- Chen YJ, Lin TL, Cai Z, Yan CH, Gou SR, Zhuang YD. Assessment of acute pancreatitis severity via determination of serum levels of hsa-miR-126-5p and IL-6. Exp Ther Med 2021;21(1):26.
- Mi JL, Xu M, Liu C, Wang RS. Identification of novel biomarkers and small-molecule compounds for nasopharyngeal carcinoma with metastasis. Medicine 2020;99(32):e21505.
- Guo H, Yan Z, Hu Y, Huang X, Pan C. Complement C7 is specifically expressed in mesangial cells and is a potential diagnostic biomarker for diabetic nephropathy and is regulated by miR-494-3p and miR-574-5p. Diabetes Metab Syndr Obes 2021:3077-3088.
- Li J, Tian S, Guo Y, Dong W. Oncological Effects and Prognostic Value of AMAP1 in Gastric Cancer. Front Genet 2021;12:675100.
- Ghafouri-Fard S, Gholipour M, Taheri M. Role of microRNAs in the pathogenesis of coronary artery disease. Front Cardiovasc Med 2021;8:632392.
- Wu J, Venkata Subbaiah KC, Jiang F, Hedaya O, Mohan A, Yang T, et al. MicroRNA-574 regulates FAM210A expression and influences pathological cardiac remodeling. EMBO Mol Med 2021;13(2):e12710.
- Li W, Ding X, Wang S, Xu L, Yin T, Han S, et al. Downregulation of serum exosomal miR-320d predicts poor prognosis in hepatocellular carcinoma. J Clin Lab Anal 2020;34(6):e23239.
- Huang C, Yue W, Li L, Li S, Gao C, Si L, et al. Expression of MiR-608 in nonsmall cell lung cancer and molecular mechanism of apoptosis and migration of A549 cells. Biomed Res Int 2020;2020:8824519.
- Liu H, Zhou Y, Liu Q, Xiao G, Wang B, Li W, et al. Association of miR-608 rs4919510 polymorphism and cancer risk: a meta-analysis based on 13,664 subjects. Oncotarget 2017;8(23):37023.
- Nagy A, Lanczky A, Menyhart O, Gyorffy B. Validation of miRNA prognostic power in hepatocellular carcinoma using expression data of independent datasets. Sci Rep 2018;8(1):9227.
- Zhou M, Gao Y, Wang M, Guo X, Li X, Zhu F, et al. MiR-146b-3p regulates proliferation of pancreatic cancer cells with stem cell-like properties by targeting MAP3K10. J Cancer 2021;12(12):3726.
- Yu C, Zhang L, Luo D, Yan F, Liu J, Shao S, et al. MicroRNA-146b-3p promotes cell metastasis by directly targeting NF2 in human papillary thyroid cancer. Thyroid 2018;28(12):1627-1641.
- Jamali L, Tofigh R, Tutunchi S, Panahi G, Borhani F, Akhavan S, et al. Circulating microRNAs as diagnostic and therapeutic biomarkers in gastric and esophageal cancers. J Cell Physiol 2018;233(11):8538-8550.
- de Melo Maia B, Lavorato-Rocha AM, Rodrigues LS, Coutinho-Camillo CM, Baiocchi G, Stiepcich MM, et al. microRNA portraits in human vulvar carcinoma. Cancer Prev Res 2013;6(11):1231-1241.
- Wei Y, He R, Wu Y, Gan B, Wu P, Qiu X, et al. Comprehensive investigation of aberrant microRNA profiling in bladder cancer tissues. Tumor Biol 2016;37:12555-12569.
- Wang M, Qiu Y, Zhang R, Gao L, Wang X, Bi L, et al. MEHP promotes the proliferation of oral cancer cells via down regulation of miR-27b-5p and miR-372-5p. Toxicol In Vitro 2019;58:35-41.
- Liu CH, Jing XN, Liu XL, Qin SY, Liu MW, Hou CH. Tumor-suppressor miRNA-27b-5p regulates the growth and metastatic behaviors of ovarian carcinoma cells by targeting CXCL1. J Ovarian Res 2020;13(1):92.
- Kim YJ, Jeong S, Jung WY, Choi JW, Hwang KC, Kim SW, et al. miRNAs as potential biomarkers for the progression of gastric cancer inhibit CREBZF and regulate migration of gastric adenocarcinoma cells. Int J Med Sci 2020;17(6):693-701.
- Yi H, Geng L, Black A, Talmon G, Berim L, Wang J. The miR-487b-3p/GRM3/TGFβ signaling axis is an important regulator of colon cancer tumorigenesis. Oncogene 2017;36(24):3477-3489.
- Cheng M, Duan PG, Gao ZZ, Dai M. MicroRNA-487b-3p inhibits osteosarcoma chemoresistance and metastasis by targeting ALDH1A3. Oncol Rep 2020;44(6):2691-2700.
- Zhao X, Wang S, Sun W. Expression of miRâ??28â??3p in patients with Alzheimer's disease before and after treatment and its clinical value. Exp Ther Med 2020;20(3):2218-2226.
- Lv Y, Yang H, Ma X, Wu G. Strand-specific miR-28-3p and miR-28-5p have differential effects on nasopharyngeal cancer cells proliferation, apoptosis, migration and invasion. Cancer Cell Int 2019;19:187.
- Guo Y, Cui X, Zhang Y, Ma X, Ren A, Huang H. Diagnostic and prognostic value of serum miR-296-5p and miR-28-3p in human gastric cancer. Cancer Biother Radiopharm 2023;38(2):95-101.
- Wang YP, Liu J, Liu D, Wang XD, Bian AM, Fang DZ, et al. MiR-532-5p acts as a tumor suppressor and inhibits glioma cell proliferation by targeting CSF1. Eur Rev Med Pharmacol Sci 2020;24(13):7206.
- Zhang W, Zhang K, Zhang P, Zheng J, Min C, Li X. Research progress of pancreas-related microorganisms and pancreatic cancer. Front Oncol 2021;10:604531.
- Wei H, Tang QL, Zhang K, Sun JJ, Ding RF. miR-532-5p is a prognostic marker and suppresses cells proliferation and invasion by targeting TWIST1 in epithelial ovarian cancer. Eur Rev Med Pharmacol Sci 2018;22(18):5842-5850.
- Yamada Y, Arai T, Kato M, Kojima S, Sakamoto S, Komiya A, et al. Role of pre-miR-532 (miR-532-5p and miR-532-3p) in regulation of gene expression and molecular pathogenesis in renal cell carcinoma. Am J Clin Exp Urol 2019;7(1):11-30.
- Mu J, Cheng X, Zhong S, Chen X, Zhao C. Neuroprotective effects of miR-532-5p against ischemic stroke. Metab Brain Dis 2020;35:753-763.
- Zhao X, Cheng S, Li S, Li J, Bai X, Xi J. CDKN2B-AS1 aggravates the pathogenesis of human thoracic aortic dissection by sponge to miR-320d. J Cardiovasc Pharmacol 2020;76(5):592-601.
- Su H, Chang J, Xu M, Sun R, Wang J. CDK6 overexpression resulted from microRNA-320d downregulation promotes cell proliferation in diffuse large Bâ??cell lymphoma. Oncol Rep 2019;42(1):321-327.
- Liu X, Xu X, Pan B, He B, Chen X, Zeng K, et al. Circulating miR-1290 and miR-320d as novel diagnostic biomarkers of human colorectal cancer. J Cancer 2019;10(1):43-50.
- Su Y, Yuan J, Zhang F, Lei Q, Zhang T, Li K, et al. MicroRNA-181a-5p and microRNA-181a-3p cooperatively restrict vascular inflammation and atherosclerosis. Cell Death Dis 2019;10(5):365.
- Mao W, Huang X, Wang L, Zhang Z, Liu M, Li Y, et al. Circular RNA hsa_circ_0068871 regulates FGFR3 expression and activates STAT3 by targeting miR-181a-5p to promote bladder cancer progression. J Exp Clin Cancer Res 2019;38(1):169.
- Wen X, Li S, Guo M, Liao H, Chen Y, Kuang X, et al. miR-181a-5p inhibits the proliferation and invasion of drug-resistant glioblastoma cells by targeting F-box protein 11 expression. Oncol Lett 2020;20(5):235.
- Shen H, Weng XD, Liu XH, Yang D, Wang L, Guo J, et al. miR-181a-5p is downregulated and inhibits proliferation and the cell cycle in prostate cancer. Int J Clin Exp Pathol 2018;11(8):3969-3976.
- Yu J, Jiang L, Gao Y, Sun Q, Liu B, Hu Y, et al. LncRNA CCAT1 negatively regulates miR-5p to promote endometrial carcinoma cell proliferation and migration. Exp Ther Med 2019;17(5):4259-4266.
- Liu Y, Cheng T, Du Y, Hu X, Xia W. LncRNA LUCAT1/miR-181a-5p axis promotes proliferation and invasion of breast cancer via targeting KLF6 and KLF15. BMC Mol Cell Biol 2020;21(1):69.
- Jaswani P, Prakash S, Agrawal S, Prasad N, Sharma RK. Predicting miRNA association with corresponding target genes and single nucleotide polymorphisms in altered renal pathophysiology. Microrna 2017;6(3):213-221.
- Bi X, Lv X, Liu D, Guo H, Yao G, Wang L, et al. METTL3-mediated maturation of miR-126-5p promotes ovarian cancer progression via PTEN-mediated PI3K/Akt/mTOR pathway. Cancer Gene Ther 2021;28(3-4):335-349.
- Xue S, Liu D, Zhu W, Su Z, Zhang L, Zhou C, et al. Circulating MiR-17-5p, MiR-126-5p and MiR-145-3p are novel biomarkers for diagnosis of acute myocardial infarction. Front Physiol 2019;10:123.
- Chen Z, Pan X, Sheng Z, Yan G, Chen L, Ma G. Baicalin suppresses the proliferation and migration of Ox-LDL-VSMCs in atherosclerosis through upregulating miR-126-5p. Biol Pharm Bull 2019;42(9):1517-1523.
- Meng X, Liu J, Wang H, Chen P, Wang D. MicroRNA-126-5p downregulates BCAR3 expression to promote cell migration and invasion in endometriosis. Mol Cell Endocrinol 2019;494:110486.
- Wang C, Zhou B, Liu M, Liu Y, Gao R. miR-126-5p restoration promotes cell apoptosis in cervical cancer by targeting Bcl2l2. Oncol Res 2017;25(4):463-470.
- Li Y, Huo J, Pan X, Wang C, Ma X. MicroRNA 302b-3p/302c-3p/302d-3p inhibits epithelial-mesenchymal transition and promotes apoptosis in human endometrial carcinoma cells. Onco Targets Ther 2018;11:1275-1284.
- Wang J, Chen S. RACK1 promotes miR-302b/c/d-3p expression and inhibits CCNO expression to induce cell apoptosis in cervical squamous cell carcinoma. Cancer Cell Int 2020;20(1):1-2.
- Drewry MD, Challa P, Kuchtey JG, Navarro I, Helwa I, Hu Y, et al. Differentially expressed microRNAs in the aqueous humor of patients with exfoliation glaucoma or primary open-angle glaucoma. Hum Mol Genet 2018;27(7):1263-1275.
- Yang Y, Sun Z, Liu F, Bai Y, Wu F. FGD5-AS1 inhibits osteoarthritis development by modulating miR-302d-3p/TGFBR2 axis. Cartilage 2021;13(2_suppl):1412S-1420S.
- Wang Q, Gu M, Zhuang Y, Chen J. The long noncoding RNA MAGI1-IT1 regulates the MiR-302d-3p/IGF1 axis to control gastric cancer cell proliferation. Cancer Manag Res 2021:2959-2967.
- Sun D, Zhong J, Wei W, Liu L, Liu J, Lin X. Long non-coding RNAs lnc-ANGPTL1-3: 3 and lnc-GJA10-12: 1 present as regulators of sentinel lymph node metastasis in breast cancer. Oncol Lett 2020;20(5):188.
- Ma C, Qin J, Zhang J, Wang X, Wu D, Li X. Construction and analysis of circular RNA molecular regulatory networks in clear cell renal cell carcinoma. Mol Med Rep 2020;21(1):141-150.
- Lin Z, Zhou Z, Guo H, He Y, Pang X, Zhang X, et al. Long noncoding RNA gastric cancer-related lncRNA1 mediates gastric malignancy through miRNA-885-3p and cyclin-dependent kinase 4. Cell Death Dis 2018;9(6):607.
- Zhang MY, Wang LQ, Chim CS. miR-1250-5p is a novel tumor suppressive intronic miRNA hypermethylated in non-Hodgkin’s lymphoma: novel targets with impact on ERK signaling and cell migration. Cell Commun Signal 2021;19(1):62.
- Wang H, Jiang F, Liu W, Tian W. miR-595 suppresses cell proliferation and metastasis in hepatocellular carcinoma by inhibiting NF-κB signalling pathway. Pathol Res Pract 2020;216(4):152899.
- Hao Y, Zhang S, Sun S, Zhu J, Xiao Y. MiR-595 targeting regulation of SOX7 expression promoted cell proliferation of human glioblastoma. Biomed Pharmacother 2016;80:121-126.
- Krissansen GW, Yang Y, McQueen FM, Leung E, Peek D, Chan YC, et al. Overexpression of miR-595 and miR-1246 in the sera of patients with active forms of inflammatory bowel disease. Inflamm Bowel Dis 2015;21(3):520-530.
- Keller A, Ludwig N, Fehlmann T, Kahraman M, Backes C, Kern F, et al. Low miR-150-5p and miR-320b expression predicts reduced survival of COPD patients. Cells 2019;8(10):1162.
- Song QH, Guo MJ, Zheng JS, Zheng XH, Ye ZH, Wei P. Study on targeting relationship between miR-320b and FGD5-AS1 and its effect on biological function of osteosarcoma cells. Cancer Manag Res 2020:13589-13598.
- Lv QL, Du H, Liu YL, Huang YT, Wang GH, Zhang X, et al. Low expression of microRNA-320b correlates with tumorigenesis and unfavorable prognosis in glioma. Oncol Rep 2017;38(2):959-966.
- Zhang R, Qin Y, Zhu G, Li Y, Xue J. Low serum miR-320b expression as a novel indicator of carotid atherosclerosis. J Clin Neurosci 2016;33:252-258.
- Jingyang Z, Jinhui C, Lu X, Weizhong Y, Yunjiu L, Haihong W, et al. Mir-320b inhibits pancreatic cancer cell proliferation by targeting FOXM1. Curr Pharm Biotechnol 2021;22(8):1106-1113.
- Matamala N, Lara B, Gomez-Mariano G, Martinez S, Vazquez-Dominguez I, Otero-Sobrino A, et al. miR-320c regulates SERPINA1 expression and is induced in patients with pulmonary disease. Arch Bronconeumol 2021;57(7):457-463.
- Lim S, Kim Y, Lee SB, Kang HG, Kim DH, Park JW, et al. Inhibition of Chk1 by miR-320c increases oxaliplatin responsiveness in triple-negative breast cancer. Oncogenesis 2020;9(10):91.
- Wang X, Wu J, Lin Y, Zhu Y, Xu X, Xu X, et al. MicroRNA-320c inhibits tumorous behaviors of bladder cancer by targeting Cyclin-dependent kinase 6. J Exp Clin Cancer Res 2014;33(1):69.
- Du B, Wang T, Yang X, Wang J, Shi X, Wang X, et al. SOX9, miR-495, miR-590-3p, and miR-320d were identified as chemoradiotherapy-sensitive genes and miRNAs in colorectal cancer patients based on a microarray dataset. Neoplasma 2019;66(1):8-19.
- Wan C, Wen J, Liang X, Xie Q, Wu W, Wu M, et al. Identification of miR-320 family members as potential diagnostic and prognostic biomarkers in myelodysplastic syndromes. Sci Rep 2021;11(1):183.
- Hu S, Mao G, Zhang Z, Wu P, Wen X, Liao W, et al. MicroRNA-320c inhibits development of osteoarthritis through downregulation of canonical Wnt signaling pathway. Life Sci 2019;228:242-250.
- Iwagami Y, Eguchi H, Nagano H, Akita H, Hama N, Wada H, et al. miR-320c regulates gemcitabine-resistance in pancreatic cancer via SMARCC1. Br J Cancer 2013;109(2):502-511.
- Wang X, Peng L, Gong X, Zhang X, Sun R, Du J. miR-423-5p inhibits osteosarcoma proliferation and invasion through directly targeting STMN1. Cell Physiol Biochem 2018;50(6):2249-2259.
- Lin H, Lin T, Lin J, Yang M, Shen Z, Liu H, et al. Inhibition of miR-423-5p suppressed prostate cancer through targeting GRIM-19. Gene 2019;688:93-97.
- Zhao P, Sun S, Zhai YE, Tian Q, Zhou T, Li J. miR-423-5p inhibits the proliferation and metastasis of glioblastoma cells by targeting phospholipase C beta 1. Int J Clin Exp Pathol 2019;12(8):2941.
- Tang X, Zeng X, Huang Y, Chen S, Lin F, Yang G, et al. miR-5p serves as a diagnostic indicator and inhibits the proliferation and invasion of ovarian cancer. Exp Ther Med 2018;15(6):4723-4730.
- Yang C, Liu Z, Chang X, Xu W, Gong J, Chai F, et al. NR2F1-AS1 regulated miR-423-5p/SOX12 to promote proliferation and invasion of papillary thyroid carcinoma. J Cell Biochem 2020;121(2):2009-2018.
- Shang Y, Wang L, Zhu Z, Gao W, Li D, Zhou Z, et al. Downregulation of miR-423-5p contributes to the radioresistance in colorectal cancer cells. Front Oncol 2021;10:582239.
- Tu H, Yang S, Jiang T, Wei L, Shi L, Liu C, et al. Elevated pulmonary tuberculosis biomarker miR-423-5p plays critical role in the occurrence of active TB by inhibiting autophagosome-lysosome fusion. Emerg Microbes Infect 2019;8(1):448-460.
- Yeh TC, Huang TT, Yeh TS, Chen YR, Hsu KW, Yin PH, et al. miR-151-3p targets TWIST1 to repress migration of human breast cancer cells. PloS one 2016;11(12):e0168171.
- Li X, Liu Y, Zhang X, Shen J, Xu R, Liu Y, et al. Circular RNA hsa_circ_0000073 contributes to osteosarcoma cell proliferation, migration, invasion and methotrexate resistance by sponging miR-145-5p and miR-151-3p and upregulating NRAS. Aging (Albany NY) 2020;12(14):14157-14173.
- McNally ME, Collins A, Wojcik SE, Liu J, Henry JC, Jiang J, et al. Concomitant dysregulation of microRNAs miR-151-3p and miR-126 correlates with improved survival in resected cholangiocarcinoma. Hpb 2013;15(4):260-264.
- Liu H, Cheng Y, Xu Y, Xu H, Lin Z, Fan J, et al. The inhibition of tumor protein p53 by microRNA-151a-3p induced cell proliferation, migration and invasion in nasopharyngeal carcinoma. Biosci Rep 2019;39(10):BSR20191357.
- Hsu KW, Fang WL, Huang KH, Huang TT, Lee HC, Hsieh RH, et al. Notch1 pathway-mediated microRNA-151-5p promotes gastric cancer progression. Oncotarget 2016;7(25):38036.
- Rhim AD, Mirek ET, Aiello NM, Maitra A, Bailey JM, McAllister F, et al. EMT and dissemination precede pancreatic tumor formation. Cell 2012;148(1):349-361.
- Javadrashid D, Baghbanzadeh A, Derakhshani A, Leone P, Silvestris N, Racanelli V, et al. Pancreatic cancer signaling pathways, genetic alterations, and tumor microenvironment: The barriers affecting the method of treatment. Biomedicines 2021;9(4):373.
- Ansari D, Ohlsson H, Althini C, Bauden M, Zhou Q, Hu D, et al. The Hippo signaling pathway in pancreatic cancer. Anticancer Res 2019;39(7):3317-3321.
- Lysine degradation-Reference pathway. KEGG Pathway Maps 2023.
- Gasparini G, Pellegatta M, Crippa S, Schiavo Lena M, Belfiori G, Doglioni C, et al. Nerves and pancreatic cancer: new insights into a dangerous relationship. Cancers 2019;11(7):893.
- Neurotrophin signaling pathway-Homo sapiens (human). KEGG Pathway Maps 2023.
- Chen L, Miao Y, Liu M, Zeng Y, Gao Z, Peng D, et al. Pan-cancer analysis reveals the functional importance of protein lysine modification in cancer development. Front Genet 2018;9:254.
- Viral carcinogenesis-Homo sapiens (human). KEGG Pathway Maps 2023.
- Qin C, Yang G, Yang J, Ren B, Wang H, Chen G, et al. Metabolism of pancreatic cancer: paving the way to better anticancer strategies. Mol Cancer 2020;19(1):1-9.
- Koundouros N, Poulogiannis G. Reprogramming of fatty acid metabolism in cancer. Br J Cancer 2020;122(1):4-22.
- Sato T, Shibata W, Maeda S. Adhesion molecules and pancreatitis. J Gastroenterol 2019;54:99-107.
- Sommariva M, Gagliano N. E-cadherin in pancreatic ductal adenocarcinoma: A multifaceted actor during EMT. Cells 2020;9(4):1040.
- Adherens junction-Homo sapiens (human). KEGG Pathway Maps 2011.
- KEGG PATHWAY Database. KEGG Pathway Maps 2023.
- Morimura R, Komatsu S, Ichikawa D, Takeshita H, Tsujiura M, Nagata H, et al. Novel diagnostic value of circulating miR-18a in plasma of patients with pancreatic cancer. Br J Cancer 2011;105(11):1733-1740.
- Hussein NA, Kholy ZA, Anwar MM, Ahmad MA, Ahmad SM. Plasma miR-22-3p, miR-642b-3p and miR-885-5p as diagnostic biomarkers for pancreatic cancer. J Cancer Res Clin Oncol 2017;143:83-93.
- Li A, Yu J, Kim H, Wolfgang CL, Canto MI, Hruban RH, et al. MicroRNA array analysis finds elevated serum miR-1290 accurately distinguishes patients with low-stage pancreatic cancer from healthy and disease controls. Clin Cancer Res 2013;19(13):3600-3610.
- Kojima M, Sudo H, Kawauchi J, Takizawa S, Kondou S, Nobumasa H, et al. MicroRNA markers for the diagnosis of pancreatic and biliary-tract cancers. PloS one 2015;10(2):e0118220.
- Hua Y, Chen H, Wang L, Wang F, Wang P, Ning Z, et al. Low serum miR-373 predicts poor prognosis in patients with pancreatic cancer. Cancer Biomark 2017;20(1):95-100.
- Wang Z. Diagnostic performance for declined microRNA-133a in pancreatic cancer. J Cell Biochem 2020;121(8-9):3882-3886.
- Shams R, Saberi S, Zali M, Sadeghi A, Ghafouri-Fard S, Aghdaei HA. Identification of potential microRNA panels for pancreatic cancer diagnosis using microarray datasets and bioinformatics methods. Sci Rep 2020;10(1):7559.
- Wei J, Yang L, Wu YN, Xu J. Serum miR-1290 and miR-1246 as potential diagnostic biomarkers of human pancreatic cancer. J Cancer 2020;11(6):1325-1333.
- Johansen JS, Calatayud D, Albieri V, Schultz NA, Dehlendorff C, Werner J, et al. The potential diagnostic value of serum microRNA signature in patients with pancreatic cancer. Int J Cancer 2016;139(10):2312-2324.
- Schultz NA, Dehlendorff C, Jensen BV, Bjerregaard JK, Nielsen KR, Bojesen SE, et al. MicroRNA biomarkers in whole blood for detection of pancreatic cancer. JAMA 2014;311(4):392-404.
- Akamatsu M, Makino N, Ikeda Y, Matsuda A, Ito M, Kakizaki Y, et al. Specific MAPK-associated microRNAs in serum differentiate pancreatic cancer from autoimmune pancreatitis. PloS one 2016;11(7):e0158669.
- Starzyska T, Karczmarski J, Paziewska A, Kulecka M, Kusnierz K, Zeber-Lubecka N, et al. Differences between well-differentiated neuroendocrine tumors and ductal adenocarcinomas of the pancreas assessed by multi-omics profiling. Int J Mol Sci 2020;21(12):4470.













 0.92).